
I was once asked this question and at the time realized that it had never been posed to me before. I had been under fire by a very elaborate public relations campaign as that was trying to claim that my protocols; which are proper nutrition, lifestyle modification and nutritional supplementation are somehow harmful. This is an absurd notion and I’ve never personally heard of anyone being injured by legitimate nutritional supplements in spite of the anecdotal warnings that doctors often give people about them. For example, I was wrongly taught in medical school that elevated vitamin C intake causes kidney stones. Imagine my surprise when I learned that there is no recognized evidence to causally demonstrate this in the entire sum history of medical literature?
“Increasingly, we become so secure in our bubbles that we accept only information, whether true or not, that fits our opinions, instead of basing our opinions on the evidence that’s out there.” —Barack Obama
Relative to nutritional supplement safety, we even had one person who was possibly saved by my nutrition supplements without even consuming them. Last year, a roofing contractor took a bad step in our Oklahoma City manufacturing facility during expansion renovations, and a pallet of nutrition supplements broke his fall from 20+ feet! Instead of a potentially fatal crash onto the concrete floor below, he landed on the only pallet of nutritional products left in that part of the building at the time. It was truly a miracle that energized my faith.
I am a person with strong faith in God, and I’m also a scientist. Beyond my faith, when it comes to answering questions regarding science, I prefer to rely on evidenced based scientific data to explain that which can be shown, as well as the opinions of legitimate credentialed experts. The phrase “evidence-based medicine” came into fashion about 30 years ago, but the concept really began taking shape much earlier. For most people, the notion that medicine should be evidence-based seems self-evident. The idea of “evidence-based medicine” is to shift focus away from tradition, intuition, anecdote, received opinion of self-appointed “experts”, and toward the conclusions of rigorous, repeatable clinical research results and trustworthy data.
When it came to nutritional supplement safety data, I decided to dig deeply into the issue. If you want to see if there are any fatalities associated with nutritional supplements, there are very robust databases available for study and analysis. For example, in December of 2018, the Annual Report of the American Association of Poison Control Centers was released. It’s a 203 page report of the data from all 55 United States Poison Control Centers. The data is compiled from the National Poison Data System, the data hub warehouse for the U.S. poison centers.
Overall, the top 5 most frequently encountered substances in human poison exposures are analgesics, household cleaning substances, cosmetics/personal care products, sedatives/hypnotics/antipsychotics, and antidepressants. (1)
The entire 203 page report is available here. How safe- 2017 Poison Control Report
What does this extensive report say about Nutrition Supplements?
It shows zero deaths from vitamin A, vitamin C, vitamin E, niacin, pyridoxine (B-6), or from any other B-vitamin. There were no deaths reported from any multiple vitamins designed for adults or children. There were zero deaths reported for any dietary mineral supplement. This means there were zero fatalities from calcium, magnesium, chromium, zinc, colloidal silver, selenium, iron, or multimineral supplements. The report also shows no deaths from herbs, amino acids, spirulina, glucosamine or chondroitin.
There were no deaths reported from any homeopathic remedy, Asian medicine, or Ayurvedic medicine. A single fatality from an unnamed “Unknown Single Ingredient Botanical” and a single death from an “Unknown Energy Drink” are both reported on page 197. The clear uncertainly of such listings diminishes any claim of validity for causation since each is reported in only a single event nationwide.
“What the human being is best at doing is interpreting all new information so that their prior conclusions remain intact.”— Warren Buffett
Do we need Nutritional Supplements?
It was only back in 2002 that the AMA (American Medical Association) finally reversed their erroneous policy on vitamin supplements by announcing that the Journal of the American Medical Association would begin advising all adults to take at least one multivitamin each day.
According to Drs. Fletcher and Fairfield of Harvard University who wrote JAMA’s new guidelines, “most people do not consume an optimal amount of all vitamins by diet alone…Recent evidence has shown that suboptimal levels of vitamins, even well above those causing deficiency syndromes, are risk factors for chronic diseases such as cardiovascular disease, cancer, and osteoporosis…The high prevalence of suboptimal vitamin levels implies that the usual US diet provides an insufficient amount of these vitamins. We recommend that all adults take one multivitamin daily.” (2)
Unfortunately, when one does a google search regarding “dietary supplement dangers”, one of many results is a National Institutes of Health (NIH) Office of Dietary Supplements website report. It states on their website that, “Supplements are most likely to cause side effects or harm when people take them instead of prescribed medicines or when people take many supplements in combination.” (3)
When one reads that, the very idea that this is an issue worthy of being addressed by the National Institutes of Health may make you consider that this is a widespread problem, right? There must be scores of people who have been fatally injured from legitimate nutrition supplements right? If that were accurate, where are all the stories about these fatalities? Where are the Senate investigations? Where are the Congressional hearings? Where are the lawsuits? Where are the injured people or their family members screaming for justice? Where is the news coverage? (crickets)
If we look at the risks of pharmaceutical drugs, the picture is far different.
“In 2017, just over half of human exposure cases managed by PCCs [Poison Control Centers] involved drugs and medications (53%).” (4, 5)
The Pharmaceutical industry even tries to associate nutritional products with their own harmful drug products.
“All prescription and OTC medicines, vitamins, and herbals are potentially dangerous”. (6)
Really? Instead of throwing around words like “potentially dangerous”, how about they show us scientific data regarding the dangers? For example, people can drink water to the point of water intoxication, which can be fatal. Should the drinking of water be listed as “potentially dangerous” for everyone? A person can conceivably eat so much lettuce as to cause gastric rupture. Should we list eating lettuce as “potentially dangerous” because of this possible issue? If someone takes a whole bottle of vitamins, they might get sick. If someone takes a whole bottle of aspirin, their survival is highly unlikely.
How many Nutrition Supplement fatalities are there?
The United States Centers for Disease Control has a massive database of U.S. fatalities which goes back to 1999. The CDC Wonder database lists no fatalities for the entire database record of 1999-2017 for vitamin or mineral nutrition supplements. (7)
I have found no government database which demonstrates a documented causal connected fatal injury from consuming legitimate vitamin and mineral nutrition supplements. NOT A SINGLE ONE. I have never seen a causally related injury due to a legitimate nutritional supplement beyond loose bowels.
This got me thinking about risk, since so many of my peers in the medical profession call nutrition supplementation “risky” as they write countless pharmaceutical prescriptions, many of which are “Off label”. I decided to dig deeper and look at a wide variety of possible lifetime events that are more likely to cause death than consuming legitimate nutritional supplements.
Do you know as much as your doctor about nutrition
About Odds and Risk
All risk estimates on this page are average risks extrapolated from numerous data sources. Your risk may be higher or lower than any of these numbers depending on your particular lifestyle risk factors. The baseline risk estimates do not account for any specific person’s behaviors, age, sex, location, where they live and or drive, what kind of work they do, or countless other factors that could shift the individual results. These are simply an average of the entire U.S. population. Most odds are based on 2017 U.S. death, population, and life expectancy data. All odds given are statistical averages over the whole U.S. population and do not necessarily reflect the chances of death for any particular person from any particular external cause or event.
The one-year odds were approximated by dividing the 2017 U.S. population of (325,719,178) by the number of deaths per cause. The lifetime odds are approximated by dividing the one-year odds by the life expectancy of a person born in 2017 of 78.6 years (8, 9).
“In 2016, life expectancy at birth was 78.6 years for the total U.S. population”. (9)
For example, the odds of dying from in a motor-vehicle crash in 2017 were 1 in 8,771.
The lifetime odds of dying in a motor-vehicle crash for a person born in 2017 are currently 1 in 111. If a person is never anywhere near a motor vehicle, then their odds are significantly lower.
Being Aborted as a Fetus
Isaiah 5:20, Woe to those who say that good is bad and bad is good, Those who substitute darkness for light and light for darkness, Those who put bitter for sweet and sweet for bitter!
*If you believe that life begins at the point of conception, then you may accept this data. If you believe that life begins at the point of birth, then you may disregard this data. Regardless of your stance on abortion, the amount of abortions taking place is significant, and likely underreported.
The U.S. Department of Health & Human Services website currently spells out the Mission Statement and Organizational Structure of the HHS. As far as determining when life begins, they state, “HHS is the U.S. Government’s principal agency for protecting the health of all Americans and providing essential human services, especially for those who are least able to help themselves. HHS accomplishes its mission through programs and initiatives that cover a wide spectrum of activities, serving and protecting Americans at every stage of life, from conception.” (10)
The 2018 U.S. Department of Health and Human Services, 2018 Annual Report states on Page 33 that, “..a core component of HHS’s mission is the dedication to protecting the life of all Americans at every stage of life, beginning at conception.” (11)
This is also reiterated in strategic goal 3 of the HHS website which states that, “A core component of the HHS mission is the dedication to serve all Americans from conception to natural death…”(12)
On page 31 of the 2018 U.S. Department of Health and Human Services, 2018 Annual Report it states that,
“In 2018, these efforts involved a special emphasis on the value of work and community engagement to physical and mental well-being, as well as prioritizing respect for life from conception until natural death.” (11)
HHS Strategic objective 1.4 from the HHS website notes that, “This goal seeks to improve healthcare outcomes for all people across the lifespan, including the unborn, children, youth, adults, and older adults, across healthcare settings.” (13)
As part of HHS Strategic Objective 1.3 from the HHS website, “Promote healthy pregnancy by protecting unborn children from harm through proven strategies such as receipt of adequate prenatal care and the identification and treatment of diabetes and hypertension”. (14)
Based on the above, the stance of the U.S. Department of Health and Human Services appears to be that life begins at conception.
The Centers for Disease Control and Prevention (CDC) appears to significantly underreport the number of abortions on their most recent comprehensive report from 2015.
“In 2015, 638,169 legal induced abortions were reported to CDC from 49 reporting areas. The abortion rate for 2015 was 11.8 abortions per 1,000 women aged 15–44 years (1 in 84), and the abortion ratio was 188 abortions per 1,000 live births.” (15)
The CDC notes in their own, most recent report that their total number of reported abortions is smaller than that reported by the Guttmacher Institute. (16, 17, 18) The Guttmacher Institute is a research and policy organization founded in 1968, dedicated to an agenda of sexual and reproductive health policies in the United States and globally.
“During the period covered by this report, the total annual number of abortions reported to CDC was 68%–71% of the number recorded by the Guttmacher Institute through a national census of abortion providers.” – Abortion Surveillance — United States, 2015 (19, 20, 21)
A more accurate number was reported in Perspectives on Sexual and Reproductive Health, using the extensive Guttmacher Institute survey. “In 2014, an estimated 926,200 abortions were performed in the United States…” It further noted that in 2014, some 1.5% of women aged 15–44 had an abortion, and that nineteen percent of pregnancies (excluding miscarriages) in 2014 ended in abortion. (21)
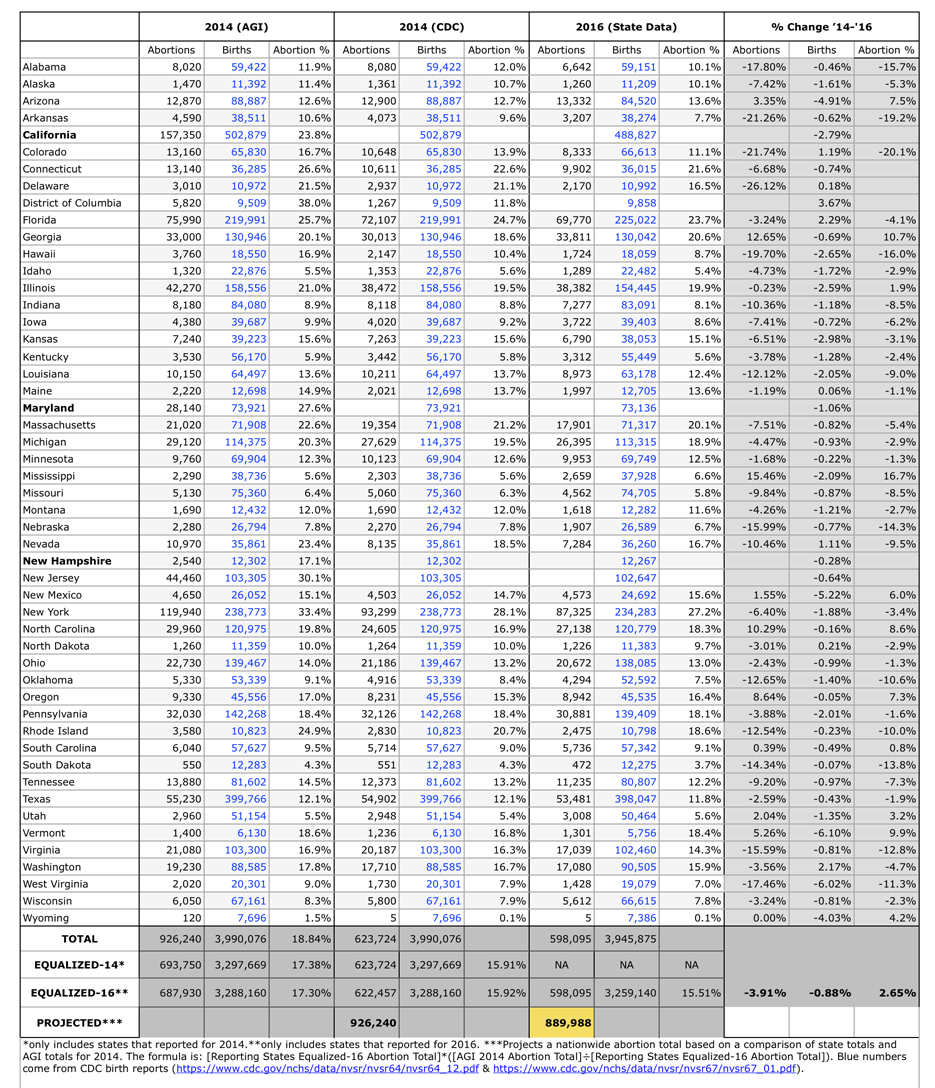
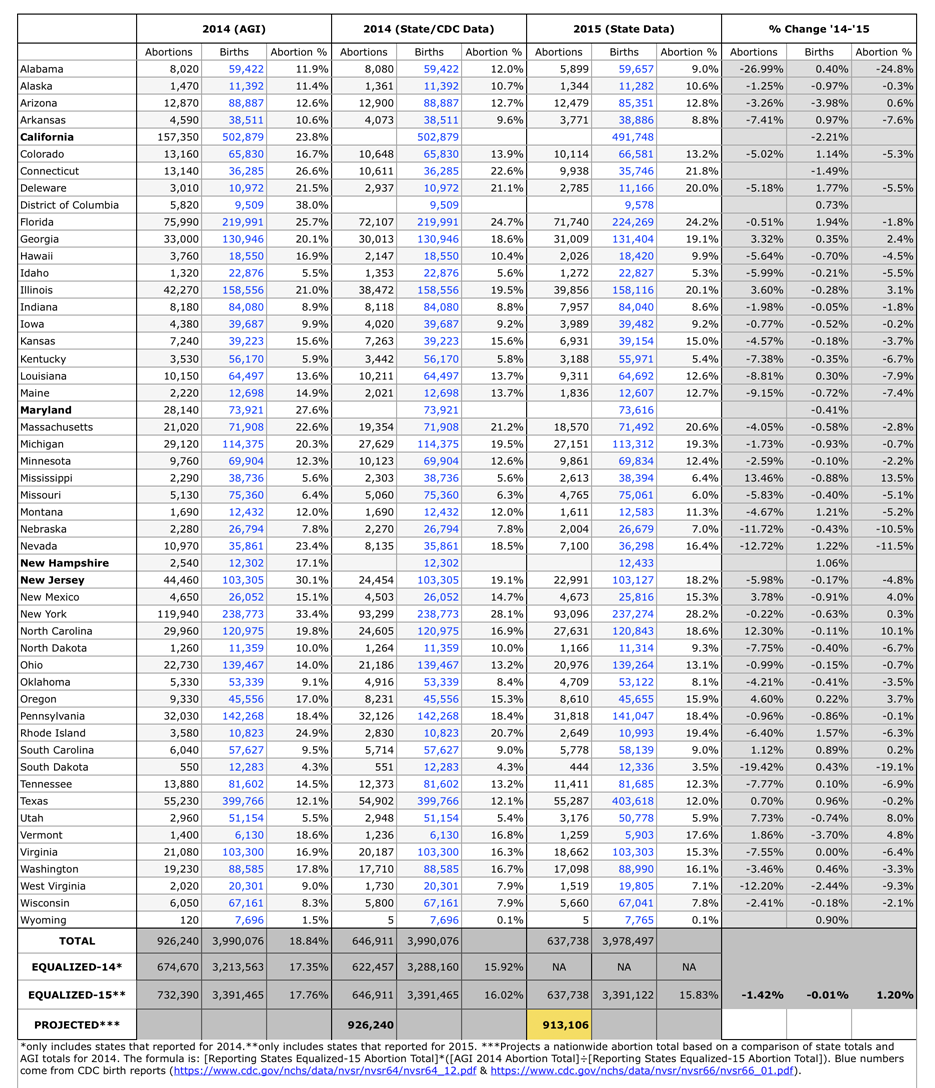
Based on the latest state-level data, approximately 879,000 abortions (22) took place in the United States in 2017—down from approximately 892,000 abortions (23) in 2016 and 913,000 abortions (24) in 2015. The average number of abortions for each of those 3 years is 894,667. If we add the 2014 Guttmacher survey data total of approximately 926,200 abortions for that year, we get an annual average for 2014 through 2017 of 902,500 abortions for each year.
Based on the Guttmacher Institute data (16), which the CDC references and does not dispute, the number of abortions in the U.S. could range from 898,829 to 938,484 or even higher using the 68% to 71% figures cited by the CDC. If you choose to believe that life begins at the point of conception, then abortion is the leading cause of death in the United States. You can also choose to believe that life begins at birth and completely disregard this data set and its implications. I’ve rounded down from the most accurate numbers available to arrive at a very conservative estimate of 875,000 abortions annually in the United States as part of the risk estimate.
There are currently about 3,855,500 births annually. (25)
If we add the number of live births (3,855,500) and the conservative abortions estimate of (875,000), we get a total for reported births and abortions of (4,730,500). When we divide that by (875,000) we get 5.41, rounded down to 5. That equates to a 1 in 5 risk of being aborted as a fetus, which is congruent with previously reported published data.
“In 2011, there were 1.06 million abortions, and 21% of pregnancies were terminated.” (20)
“In 2014, there were 926,200 abortions…Nineteen percent of pregnancies (excluding miscarriages) ended in abortion in 2014.” (21)
Nearly half (45%) of all pregnancies among U.S. women in 2011 were unintended, and about four in 10 of these were terminated by abortion. (26)
At 2014 abortion rates, one in 20 women (5%) will have an abortion by age 20, about one in five (19%) by age 30 and about one in four (24%) by age 45. (27)
Seventeen percent of abortion patients in 2014 identified as mainline Protestant, 13% as evangelical Protestant and 24% as Catholic; 38% reported no religious affiliation and the remaining 8% reported some other affiliation. (28)
The World Health Organization (WHO) notes that, “On average, 56 million abortions occurred worldwide each year in 2010–2014. This is an increase from 50 million annually in 1990–1994, resulting primarily from population growth.” (29)
According to the United Nations’ 2013 report (30), only nine countries in the world have a higher reported abortion rate than the United States. They are: Bulgaria, Cuba, Estonia, Georgia, Kazakhstan, Romania, Russia, Sweden, and Ukraine. Even though the UN lists China’s official abortion rate at 19.2, China’s actual abortion rate is likely much higher.
Regarding abortions in China, the U.S. Department of State 2015 human rights report says that in China, “The National Health Population and Family Planning Commission reported that 13 million women annually terminated unplanned pregnancies. An official news media outlet also reported at least an additional 10 million chemically induced abortions were performed in nongovernment facilities.” (31)
I personally feel that any life lost unnecessarily is a tragedy, but in this system of things, women have this as a legal option in many places. No matter what the circumstances of conception, no matter how far along a pregnancy is, a completed abortion ends the life of an individual human being. Every honest abortion advocate should understand that fact.
Heart Disease
“About 610,000 people die of heart disease in the United States every year–that’s 1 in every 4 deaths.”
(32, 33) For 2017, the CDC WISQARS™database lists 647,457 heart disease fatalities.
The U.S. Centers for Disease Control and Prevention note the risk of death as 1 in 4, but we’ll go with a more conservative estimate of 1 in 5.
Cancer
- According to the latest official federal statistics on cancer incidence and deaths, produced by the Centers for Disease Control and Prevention (CDC) and the National Cancer Institute (NCI),
“One of every four deaths in the United States is due to cancer.”(34)
- The American Cancer Society website has a section called, Lifetime Risk of Developing or Dying From Cancer. It lists the lifetime risk for both men and women for dying of cancer at 1 in 5. (35)
- The medical journal, CA: A Cancer Journal for Clinicians, published the 2019 Cancer statistics in January of 2019. “A total of 2,744,248 deaths were recorded in the United States in 2016, 22% of which were from cancer.” (36)
- The article, “The top 10 leading causes of death in the United States” from Medical News Today, written by Hannah Nichols and Reviewed by Timothy J. Legg, PhD, CRNP, confronts the cancer issue. In relation to the total deaths attributed to cancer, “Percentage of total deaths: 22.5 percent”. (37)
- “In 2018, an estimated 1,735,350 new cases of cancer will be diagnosed in the United States and 609,640 people will die from the disease.” (38)
- The Canadian Cancer Society website shares their “Cancer statistics at a glance”. They stated that:
“1 in 2 Canadians (49% of men and 45% of women) is expected to develop cancer during their lifetime.” It also states that, “1 out of 4 Canadians (28% of men and 24% of women) is expected to die from cancer.” (39)
- Cancer Research UK addresses lifetime risk of developing cancer stating, “1 in 2 UK people will be diagnosed with cancer in their lifetime”. (40)
Cancer Research UK also addresses the lifetime risk of dying from cancer. “Cancer causes more than one in four of all deaths, 2016, UK”. They list the UK mortality at 28% attributable to cancer. (41)
- “In Germany, nearly a quarter of men and 20% of women die of cancer, and it is estimated that in Germany around 51% men and 43% women will develop cancer during lifetime.” (42)
- Australian Government, Australian Institute of Health and Welfare. Cancer, overview. (43)
- “3 in every 10 deaths in Australia in 2016 were due to cancer.”
- “1 in 2 people will be diagnosed by the age of 85.”
- “1 in 4 men and 1 in 6 women will die from cancer by the age of 85.”
- New Zealand Herald, Global cancer rates: How does NZ compare? 5 Jun, 2018, By: Jamie Morton
“Figures released by the Ministry of Health last month showed more than 9500 people died from cancer each year, representing 31 percent of all deaths recorded in New Zealand.” (44)
Since the most accurate data available demonstrates risk ranges from between 1 in 5 down to 1 in 4, we’ll stick with the more conservative estimate of 1 in 5.
Medical Errors
“We believe the number of 251,000 people dying per year just in the United States from medical error or medical care gone wrong is a very conservative estimate.” (45)
“We recognize that the true death toll from medical care gone wrong is likely higher.”
Dr. Martin Makary, M.D., M.P.H., Professor of Surgery at Johns Hopkins University School of Medicine (46)
“One-third of patients with health problems in the U.S. report experiencing medical, medication, or test errors, the highest rate of any nation in a new Commonwealth Fund international survey.”(47)
Annual risk of dying from medical errors or medical care gone wrong is 1 in 1,298. Lifetime risk is 1 in 16.
251,000 annual fatalities are an annual risk of 1 in 1,298 and a lifetime risk of 1 in 16.
Accidents (unintentional injuries)
The CDC reports 161,374 accident deaths for 2016. (48)
161,374 annual fatalities are an annual risk of 1 in 2,018 and a lifetime risk of 1 in 26.
Chronic lower respiratory diseases
Chronic lower respiratory is a group of diseases that affects the lungs. Chronic obstructed pulmonary disease, emphysema, chronic bronchitis and other respiratory illnesses are all grouped together under the name chronic lower respiratory disease.
The CDC reports 154,596 Chronic lower respiratory disease deaths for 2016. (48, 49, 50)
154,596 annual fatalities are an annual risk of 1 in 2,107 and a lifetime risk of 1 in 27.
Stroke
“About 795,000 people in the United States have a stroke each year.” (51, 52)
Annual risk of stroke is 1 in 465. Lifetime risk is 1 in 6.
“Stroke kills about 140,000 Americans each year…” (53)
For 2017, the CDC WISQARS™ database lists 146,383 Cerebro-vascular (Stroke) fatalities. (33)
146,383 annual fatalities are an annual risk of 1 in 2,225 and a lifetime risk of 1 in 28.
Alzheimer’s Disease
The CDC report lists 116,103 fatalities for the final 2016 data set. (48)
116,103 annual fatalities are an annual risk of 1 in 2,805 and a lifetime risk of 1 in 36.
Adverse Drug Reactions (ADR’s)
An analysis of numerous studies in which the cause of hospitalization was determined, found that approximately 1.5 million hospitalizations a year were caused by adverse drug reactions of prescribed medications. This means that every day more than 4,000 patients have adverse drug reactions so serious that they need to be admitted to American hospitals. “We estimated that in 1994 in the United States 106 000 (95% CI, 76 000-137 000) hospital patients died from an ADR. Thus, we deduced that ADRs may rank from the fourth to sixth leading cause of death.” (54)
A review of patients admitted to medical wards of a hospital found that although for 3.8% of hospital admissions, adverse drug reactions led directly to hospitalization, 57% of these adverse drug reactions were not recognized by the attending physician at the time of admission. As in numerous other studies, many of these admissions should have been prevented. In fact, 18.6% of all drugs prescribed prior to admission were contraindicated. (55) Definition of contraindicated: (of a condition or circumstance) suggest or indicate that (a particular technique or drug) should not be used in the case in question.
Adverse Drug Reactions (ADR’s) as a Major Cause of Emergency Room Visits
A review of studies concerning the causes of people going to hospital emergency rooms found that as many as 28% of all emergency department visits were drug-related, including a large proportion due to adverse drug reactions and inappropriate prescriptions, of which 24% result in hospitalization. Of all of the drug-related visits, the author found that 70% were preventable. (56)
Adverse Drug Reactions (ADR’s) after admission
According to national projections based on a study involving adverse drug reactions developing in patients in the hospital, 770,000 additional patients a year—more than 2,000 patients a day—suffer an adverse event caused by drugs once they are admitted. (57)
106,000 annual fatalities are an annual risk of 1 in 3,073 and a lifetime risk of 1 in 39.
Hospital Acquired Infections
“No single source of nationally representative data on HAIs is currently available…The authors used a multi-step approach and three data sources…We estimate that 1.7 million HAIs occurred in U.S. hospitals in 2002 and were associated with approximately 99,000 deaths.” (58, 59)
“In American hospitals alone, the Centers for Disease Control (CDC) estimates that HAIs account for an estimated 1.7 million infections and 99,000 associated deaths each year.” (59)
99,000 annual fatalities are an annual risk of 1 in 3,290 and a lifetime risk of 1 in 42.
Diabetes Mellitus
For 2017, the CDC WISQARS™ database lists 83,564 Diabetes Mellitus fatalities. (33)
83,564 annual fatalities are an annual risk of 1 in 3,898 and a lifetime risk of 1 in 50.
Accidental Poisoning
For 2017, the CDC Wonder database notes 64,795 accidental poisoning fatalities. (60)
2017, United States Unintentional Injuries – Poisoning, All Ages, All Races, Both Sexes. Total Deaths: 64,795
ICD-10 Code Deaths Percent Description
X42 29288 45.2 X42 Accidental poisoning by and exposure to narcotics and psychodysleptics [hallucinogens], not elsewhere classified
X44 26241 40.5 X44 Accidental poisoning by and exposure to other and unspecified drugs, medicaments, and biological substances
X41 5527 8.5 X41 Accidental poisoning by and exposure to antiepileptic, sedative-hypnotic, anti parkinsonism & psychotropic drugs, NEC
X45 2265 3.5 X45 Accidental poisoning by and exposure to alcohol
X47 933 1.4 X47 Accidental poisoning by and exposure to other gases and vapors
X40 237 0.4 X40 Accidental poisoning by and exposure to nonopioid analgesics, antipyretics, and antirheumatics
X49 235 0.4 X49 Accidental poisoning by and exposure to other and unspecified chemicals and noxious substances
X46 44 0.1 X46 Accidental poisoning by and exposure to organic solvents and halogenated hydrocarbons and their vapors
X43 18 0.0 X43 Accidental poisoning by and exposure to other drugs acting on the autonomic nervous system
X48 7 0.0 X48 Accidental poisoning by and exposure to pesticides
64,795 annual fatalities are an annual risk of 1 in 5,027 and a lifetime risk of 1 in 64.
Pneumonia and Influenza
For 2017, the CDC WISQARS™ database lists 55,672 pneumonia and influenza fatalities. (33)
55,672 annual fatalities are an annual risk of 1 in 5,850 and a lifetime risk of 1 in 74.
Nephritis
Nephritis is kidney inflammation. For 2017, the CDC WISQARS™ database lists 50,633 Nephritis fatalities. (33)
50,633 annual fatalities are an annual risk of 1 in 6,433 and a lifetime risk of 1 in 82.
Opioid Overdose
“Every day, more than 130 people in the United States die after overdosing on opioids.” (61)
That equates to 47,250 annual deaths. 47,250 annual fatalities are an annual risk of 1 in 6,893 and a lifetime risk of 1 in 87.
Suicide
“In 2017, 47,173 Americans died by suicide.”(33, 62)
AFSP’s latest data on suicide are taken from the Centers for Disease Control and Prevention (CDC) Data & Statistics Fatal Injury Report for 2017. 47,173 annual fatalities are an annual risk of 1 in 6,904 and a lifetime risk of 1 in 88.
Septicemia
Septicemia is a serious bloodstream infection. It’s also known as blood poisoning.
The CDC report lists 40,613 Septicemia fatalities for the final 2016 data set. (48)
40,613 annual fatalities are an annual risk of 1 in 8,020 and a lifetime risk of 1 in 102.
Chronic liver disease and cirrhosis
The CDC report lists 40,545 chronic liver disease and cirrhosis fatalities for the final 2016 data set. (63)
40,545 annual fatalities are an annual risk of 1 in 8,033 and a lifetime risk of 1 in 102.
Motor vehicle crash
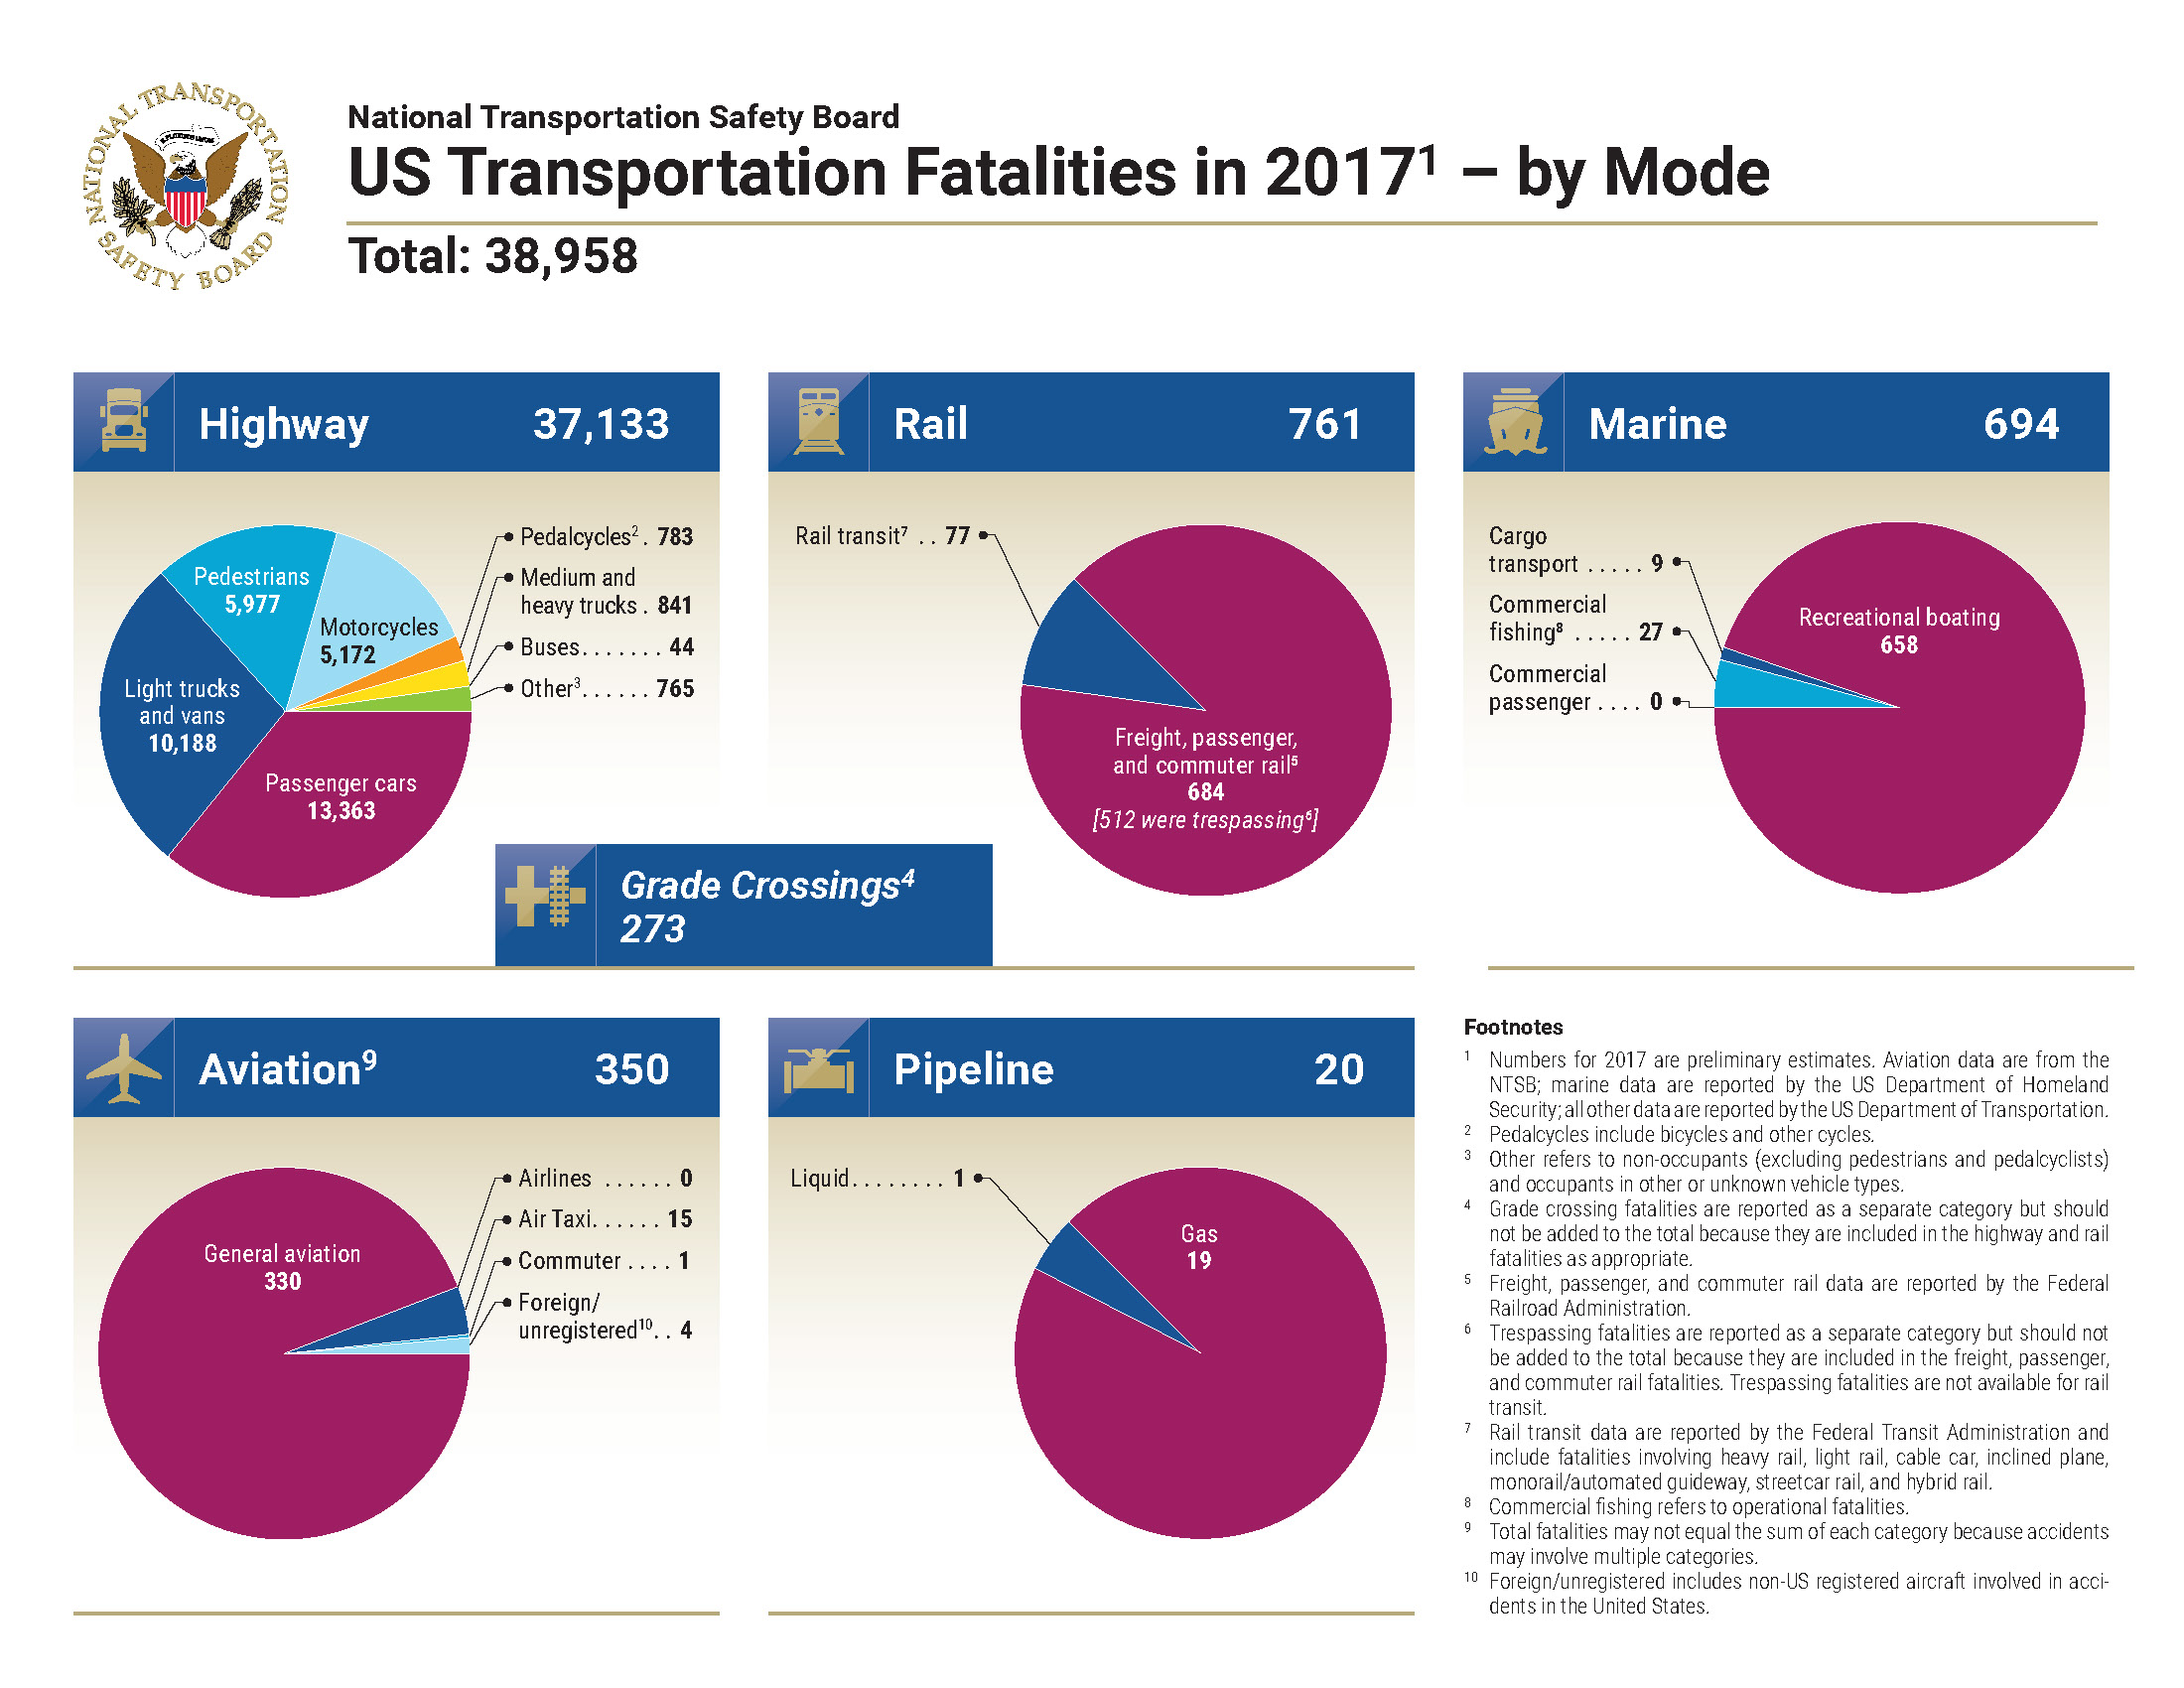
According to the National Transportation and Safety Board (NTSB), there were 37,133 highway related fatalities in 2017. (64, 65) 37,133 annual fatalities are an annual risk of 1 in 8,771 and a lifetime risk of 1 in 111.
Falls
In 2017 the CDC Wonder database lists 36,338 falling fatalities. (66)
2017, United States Unintentional Injuries – Falls, All Ages, All Races, Both Sexes. Total Deaths: 36,338
36,338 annual fatalities are an annual risk of 1 in 8,963 and a lifetime risk of 1 in 114.
Essential hypertension and hypertensive renal disease
The CDC report lists 33,246 fatalities for the final 2016 data set. (48)
33,246 annual fatalities are an annual risk of 1 in 9,797 and a lifetime risk of 1 in 125.
Parkinson’s disease
The CDC report lists 29,697 fatalities for the final 2016 data set. (48)
29,697 annual fatalities are an annual risk of 1 in 10,967 and a lifetime risk of 1 in 140.
Antibiotic Resistant Infection (ARI)
The CDC notes that,“…Each year in the U.S., at least 2 million people get an antibiotic-resistant infection, and at least 23,000 people die.” (67)
23,000 annual fatalities are an annual risk of 1 in 14,161 and a lifetime risk of 1 in 180.
Pneumonitis due to solid or liquid inhalation
Aspiration pneumonitis is caused by inhaling toxic substances, usually gastric contents (vomit), into the lungs. The CDC report lists 19,715 fatalities for the final 2016 data set. (48)
19,715 annual fatalities are an annual risk of 1 in 16,520 and a lifetime risk of 1 in 210.
Homicide (Murder)
The CDC reports 19,362 homicides for 2016. (48)
19,362 annual fatalities are an annual risk of 1 in 16,822 and a lifetime risk of 1 in 214.
AIDS
“Approximately 1.1 million people in the U.S. are living with HIV today. About 15 percent of them (1 in 7) are unaware they are infected…In 2017, 38,739 people received an HIV diagnosis in the U.S. and 6 dependent areas…In 2016, there were 15,807 deaths among people with diagnosed HIV in the United States.” (68)
Risk of HIV diagnosis annually using 2017 diagnosis figures is 1 in 8,408. Lifetime risk is 1 in 107.
15,807 annual fatalities are an annual risk of 1 in 20,605 and a lifetime risk of 1 in 262.
Work related Injury
There were 5147 occupational deaths in 2017 according to the United States Department of Labor. (69)
153,337,667 persons is the 2017 Monthly Average of employed Americans according to the United States Department of Labor. (70) Occupational injury resulting in death is a 1 in 29,791 annual risk. Lifetime risk factoring 52 working years from age 16 to age 68 is 1 in 573.
Pedestrian fatality
The Governors Highway Safety Association report projects 6,227 pedestrians were killed on U.S. roads in 2018, the highest number in nearly three decades. (71) 6,227 annual fatalities are an annual risk of 1 in 52,304 and a lifetime risk of 1 in 665.
Choking
In 2017, the CDC Wonder database lists 5,216 fatalities due to choking. (72)
5,216 annual fatalities are an annual risk of 1 in 62,442 and a lifetime risk of 1 in 794.
Drowning (outside of a bathtub)
In 2017 the CDC Wonder database notes 3,196 drowning fatalities outside of a bathtub. (73)
2017, United States Unintentional Injuries – Drowning, All Ages, All Races, Both Sexes. Total Deaths: 3,709
ICD-10 Code Deaths Percent Description
W67 659 17.8 W67 Drowning and submersion while in swimming pool
W68 64 1.7 W68 Drowning and submersion following fall into swimming pool
W69 1576 42.5 W69 Drowning and submersion while in natural water
W70 219 5.9 W70 Drowning and submersion following fall into natural water
W73 138 3.7 W73 Other specified drowning and submersion
W74 540 14.6 W74 Unspecified drowning and submersion
3,196 annual fatalities are an annual risk of 1 in 101,909 and a lifetime risk of 1 in 1,297.
Smoke, fire and flame exposure
From 1999 to 2017 the CDC Wonder database notes 56,692 fatalities due to smoke, fire and flame exposure. That’s an average of 3,150 annually. (74) 3,150 annual fatalities are an annual risk of 1 in 103,397 and a lifetime risk of 1 in 1,315.
Alcohol Poisoning (Binge drinking)
According to the Centers for Disease Control (CDC), An average of 6 people die of alcohol poisoning each day in the US. (75) 2,190 annual fatalities are an annual risk of 1 in 148,721 and a lifetime risk of 1 in 1,892.
Killed by the Police
According to Mapping Police Violence, Police in the U.S. killed 1,164 people in 2018 and 1,147 people in 2017. (76) That gives an average of 1,156 people for 2017 and 2018. 1,156 fatalities are an annual risk of 1 in 281,747 and a lifetime risk is 1 in 3,585.
Exposure to excessive natural cold
In 2017, the CDC Wonder database lists 804 fatalities due to excessive natural cold. (77)
2017, United States Unintentional Injuries – Natural/ Environment, All Ages, All Races, Both Sexes. Total Deaths: 804
ICD-10 Code Deaths Percent Description
X31 804 45.9 X31 Exposure to excessive natural cold
804 annual fatalities are an annual risk of 1 in 405,100 and a lifetime risk of 1 in 5,154.
Train or Rail Accident
According to the National Transportation and Safety Board (NTSB), there were 761 Rail Fatalities in 2017. (64, 65) 761 annual fatalities are an annual risk of 1 in 427,989 and a lifetime risk of 1 in 5,445.
Accidental suffocation or strangulation in bed
From 1999 to 2017 the CDC Wonder database notes 13,151 fatalities due to accidental suffocation or strangulation in bed. That’s an average of 730 annually. (78) 730 annual fatalities are an annual risk of 1 in 446,164 and a lifetime risk of 1 in 5,676.
Bicycle Accident
According to the Insurance Information Institute, there were an average of 723 bicyclist fatalities per year from 2007-2016. (79) 723 annual fatalities are an annual risk of 1 in 450,484 and a lifetime risk of 1 in 5,731.
Marine Transportation Accident
According to the National Transportation and Safety Board (NTSB), there were 694 marine transportation and boating related fatalities in 2017. (64, 65) 694 annual fatalities are an annual risk of 1 in 469,308 and a lifetime risk of 1 in 5,971
ATV Related Fatalities
According to the Insurance Information Institute, there were an average of 533 ATV (All Terrain Vehicle) fatalities per year from 2011 to 2015. (80) 533 annual fatalities are an annual risk of 1 in 611,069 and a lifetime risk of 1 in 7,774.
Drowning Fatalities (in a bathtub)
In 2017 the CDC Wonder database notes 513 drowning fatalities inside of bathtub. (73)
2017, United States Unintentional Injuries – Drowning, All Ages, All Races, Both Sexes. Total Deaths: 3,709
ICD-10 Code Deaths Percent Description
W65 500 13.5 W65 Drowning and submersion while in bathtub
W66 13 0.4 W66 Drowning and submersion following fall into bathtub
513 annual fatalities are an annual risk of 1 in 634,893 and a lifetime risk of 1 in 8,078.
Exposure to excessive natural heat
In 2017, the CDC Wonder database lists 465 fatalities due to excessive natural heat. (77)
2017, United States Unintentional Injuries – Natural/ Environment, All Ages, All Races, Both Sexes. Total Deaths: 465
ICD-10 Code Deaths Percent Description
X30 465 26.6 X30 Exposure to excessive natural heat
465 annual fatalities are an annual risk of 1 in 700,430 and a lifetime risk of 1 in 8,911.
Aircraft Related Fatality
According to the National Transportation and Safety Board (NTSB), there were 350 aviation related fatalities in 2017. (64, 65) 350 annual fatalities are an annual risk of 1 in 930,571 and a lifetime risk of 1 in 11,839.
Non-opioid analgesics
From 1999 to 2017 the CDC Wonder database notes 4,308 fatalities due to non-opioid analgesics. That’s an average of 239 annually. (81) This includes Nonsteroidal anti-inflammatory drugs (NSAIDs) such as Ibuprofen, Diclofenac, Indomethacin, Naproxen, Ketorolac, Aspirin, Meloxicam. COX-2 inhibitors (selective NSAID) such as Celebrex, and other non-opioid analgesics such as Acetaminophen
239 annual fatalities are an annual risk of 1 in 1,362,761 and a lifetime risk of 1 in 17,338.
Hot Tap Water
“In the United States, burns from hot tap water result in about 1,500 hospital admissions and 100 deaths per year.” (82) 100 annual fatalities are an annual risk of 1 in 3,257,000 and a lifetime risk of 1 in 41,437.
Falling from a tree
From 1999 to 2017 the CDC Wonder database notes 1602 fatalities due to falling from trees. That’s an average of 89 per year. (83) 89 annual fatalities are an annual risk of 1 in 3,659,550 and a lifetime risk of 1 in 46,559.
Tornado
“An average of 71 people have been killed annually by tornadoes (1987-2016).” (84)
71 annual fatalities are an annual risk of 1 in 4,587,324 and a lifetime risk of 1 in 58,363.
Lawn Mowers
From 1999 to 2017 the CDC Wonder database notes 1230 fatalities attributed to lawn mowers. That’s an average of 68 per year. (85) 68 annual fatalities are an annual risk of 1 in 4,789,706 and a lifetime risk of 1 in 60,938
Hornets, Bees, and Wasps
This report demonstrates 48.5 annual fatalities. (86)
However, the CDC (Centers for Disease Control) Wonder database notes 1,152 fatalities from 1999 to 2017 for an average of 64 fatalities annually. (87)
Using an average of the two, we get 56 fatalities in an average year. 56 annual fatalities are an annual risk of 1 in 5,816,071 and a lifetime risk of 1 in 73,996.
Lightning Strike
According to the National Oceanic and Atmospheric Administration, National Weather Service, there were 272 people in the U.S. who died from lightning strikes from 2009 to 2019. (88) That gives an annual average of 27.2 fatalities. 27.2 annual fatalities are an annual risk of 1 in 11,974,264 and a lifetime risk of 1 in 152,344.
Contact with sharp glass
From 1999 to 2017 the CDC Wonder database notes 428 fatalities due to sharp glass contact. That’s an average of 24 per year. (89) 24 annual fatalities are an annual risk of 1 in 13,570,833 and a lifetime risk of 1 in 172,656.
Cow attack
According to the CDC, cows caused at least 108 deaths just between 2003–2007. That’s about 21 deaths per year. (90) 21 annual fatalities are an annual risk of 1 in 15,509,524 and a lifetime risk of 1 in 197,322.
Dog bite
The CDC reports that 279 people died from dog bites between 1979 and 1994, for an average of about 18 people per year. From 1991–2001, there were 208 dog attack fatalities reported, which is an average annual increase from 18 fatalities, up to 20 average annual fatalities. (86, 91)
18 annual fatalities are an annual risk of 1 in 18,094,444 and a lifetime risk of 1 in 230,209.
School vehicle crash (Occupant)
The U.S. Department of Transportation, National Highway Traffic Safety Administration reports that between 2007 and 2016, there were 1,282 people killed in school-transportation-related
crashes—an average of 128 fatalities per year. Occupants of school transportation vehicles accounted
for 9 percent of the fatalities (12 annual occupant average), and nonoccupants (pedestrians, bicyclists, etc.) accounted for 20 percent of the fatalities. Most (70%) of the people who lost their lives in these crashes were occupants of other vehicles involved. (92)
12 annual occupant fatalities are an annual risk of 1 in 27,141,667 and a lifetime risk of 1 in 345,314.
Fireworks
From 1999 to 2017 the CDC Wonder database notes 115 fatalities due to fireworks. That’s an average of 6 per year. (93) 6 annual fatalities are an annual risk of 1 in 54,283,333 and a lifetime risk of 1 in 690,628.
Poisonous spider bite
6 fatalities annually (86) 6 annual fatalities are an annual risk of 1 in 54,283,333 and a lifetime risk of 1 in 690,628.
Poisonous snake bite
“Fewer than one in 37,500 people are bitten by venomous snakes in the U.S. each year (7-8,000 bites per year), and only one in 50 million people will die from snakebite (5-6 fatalities per year).”
(86, 94) 5 annual fatalities are an annual risk of 1 in 65,140,000 and a lifetime risk of 1 in 828,753.
Roller Coasters
“A case was defined as the death of a person, which was associated with a roller coaster in the United States between 15 May 1994 and 14 May 2004… Forty people, ranging in age from 7 to 77 years, were killed in 39 separate incidents… Approximately four deaths annually in the United States are associated with roller coasters.” (95) 4 annual fatalities are an annual risk of 1 in 81,425,000 and a lifetime risk of 1 in 1,035,941.
Vending machine fatality
The U.S. Consumer Product Safety Commission lists 37 fatalities from 1978 to 1995. (96) That is an average of 2 people dying annually from vending machine accidents. 2 annual fatalities are an annual risk of 1 in 162,850,000 and a lifetime risk of 1 in 2,071,883.
Bear attack
There are an average of 2 fatal bear attacks per year on average in the U.S. (97)
2 annual fatalities are an annual risk of 1 in 162,850,000 and a lifetime risk of 1 in 2,071,883.
Shark attack
2018 U.S. data is 32 attacks and 1 fatality. (98)
Using this data, the risk of being attacked by a shark is 1 in 10,178,128 annually, 1 in 129,492 lifetime risk. With 1 annual fatality, it is an annual risk of 1 in 325,700,000 of being killed by a shark and a lifetime risk of 1 in 4,143,766.
But, if you never go in the water, your odds are even less…
Legitimate Nutrition Supplements
0 annual fatalities. 0 fatalities demonstrated in any government database.
Any questions?
References:
- Gummin DD, Mowry JB, Spyker DA, Brooks DE, Osterthaler KM, Banner W. 2017 Annual Report of the American Association of Poison Control Centers. National Poison Data System (NPDS): 35th Annual Report. Clinical Toxicology 2018, Dec 21;:1-203. PubMed PMID: 30576252. https://doi.org/10.1080/15563650.2018.1533727
- Fletcher RH and Fairfield KM. Vitamins for chronic disease prevention in adults: Clinical Applications. JAMA, June 19, 2002; 287:3127-129. https://jamanetwork.com/journals/jama/fullarticle/195039
- National Institutes of Health, Office of Dietary Supplements, “Dietary Supplements: What You Need to Know”, https://ods.od.nih.gov/HealthInformation/DS_WhatYouNeedToKnow.aspx (Accessed April 2019)
- Gummin DD, Mowry JB, Spyker DA, Brooks DE, Osterthaler KM, et al. 2017 Annual Report of the American Association of Poison Control Centers’ National Poison Data System (NPDS): 35th Annual Report. Clin Toxicol (Phila). 2018 Dec 21;:1-203. (Data Snapshot Report) https://piper.filecamp.com/uniq/YWeDZX0aymJH8L8O.pdf
- Gummin DD, Mowry JB, Spyker DA, Brooks DE, Osterthaler KM, et al. 2017 Annual Report of the American Association of Poison Control Centers’ National Poison Data System (NPDS): 35th Annual Report. Clin Toxicol (Phila). 2018 Dec 21;:1-203. (Complete Report) https://piper.filecamp.com/uniq/cwK5Ko3PLwXzfBkk.pdf
- Pharmacytimes.com Toxins or Trauma?, Stanton, M. September 28, 2017, https://bit.ly/2UUyzfy (Accessed April 2019)
- Centers for Disease Control and Prevention, National Center for Health Statistics. Underlying Cause of Death 1999-2017 on CDC WONDER Online Database, released December, 2018. Data are from the Multiple Cause of Death Files, 1999-2017, as compiled from data provided by the 57 vital statistics jurisdictions through the Vital Statistics Cooperative Program. Accessed at http://wonder.cdc.gov/ucd-icd10.html on Apr 22, 2019 9:21:54 PM
- Centers for Disease Control and Prevention https://www.cdc.gov/nchs/data/databriefs/db293_table.pdf#1 (Accessed April 2019)
- NCHS Data Brief, No. 293, December 2017. Mortality in the United States, 2016 Kenneth D. Kochanek, M.A., Sherry L. Murphy, B.S., Jiaquan Xu, M.D., and Elizabeth Arias, Ph.D. https://www.cdc.gov/nchs/data/databriefs/db293.pdf (Accessed April 2019)
- U.S. Department of Health and Human Services, https://www.hhs.gov/about/strategic-plan/introduction/index.html (Accessed April 2019)
- 2018 U.S. Department of Health and Human Services, 2018 Annual Report, https://www.hhs.gov/sites/default/files/2018-annual-report.pdf (Accessed April 2019)
- U.S. Department of Health and Human Services, https://www.hhs.gov/about/strategic-plan/strategic-goal-3/index.html (Accessed April 2019)
- U.S. Department of Health and Human Services, https://www.hhs.gov/about/strategic-plan/strategic-goal-1/index.html (Accessed April 2019)
- U.S. Department of Health and Human Services, https://www.hhs.gov/about/strategic-plan/strategic-goal-1/index.html (Accessed April 2019)
- Centers for Disease Control and Prevention, CDCs Abortion Surveillance System FAQs, https://www.cdc.gov/reproductivehealth/data_stats/abortion.htm (Accessed April 2019)
- https://www.guttmacher.org/ (Accessed April 2019)
- The Centers for Disease Control and Prevention, https://www.cdc.gov/mmwr/volumes/67/ss/ss6713a1.htm?s_cid=ss6713a1_w (Accessed April 2019)
- The Centers for Disease Control and Prevention, https://www.cdc.gov/mmwr/volumes/67/ss/pdfs/ss6713a1-H.pdf (Accessed April 2019)
- Jones RK, Kooistra K. Abortion incidence and access to services in the United States, 2008. Perspect Sex Reprod Health 2011;43:41–50. https://doi.org/10.1363/4304111
- Jones RK, Jerman J. Abortion incidence and service availability in the United States, 2011. Perspect Sex Reprod Health 2014;46:3–14. https://doi.org/10.1363/46e0414
- Jones RK, Jerman J. Abortion incidence and service availability in the United States, 2014. Perspect Sex Reprod Health 2017;49:17–27. https://doi.org/10.1363/psrh.12015
- http://abort73.com/images/2017-abortion-data-table.png (Accessed April 2019)
- http://abort73.com/images/2016-abortion-data-table.png (Accessed April 2019)
- http://abort73.com/images/2015-abortion-data-table.png (Accessed April 2019)
- Centers for Disease Control and Prevention, Births and Natality, https://www.cdc.gov/nchs/fastats/births.htm (Accessed April 2019)
- Finer LB and Zolna MR, Declines in unintended pregnancy in the United States, 2008–2011, New England Journal of Medicine, 2016, 374(9):843–852 https://www.nejm.org/doi/full/10.1056/NEJMsa1506575
- Jones RK and Jerman J, Population group abortion rates and lifetime incidence of abortion: United States, 2008–2014, American Journal of Public Health, 2017 https://ajph.aphapublications.org/doi/10.2105/AJPH.2017.304042
- Jerman J, Jones RK and Onda T, Characteristics of U.S. Abortion Patients in 2014 and Changes Since 2008, New York: Guttmacher Institute, 2016, https://www.guttmacher.org/report/characteristics-us-abortion-patients-2014
- The World Health Organization, https://www.who.int/reproductivehealth/news/440KeyAbortionFactsFinal.pdf (Accessed April 2019)
- United Nations, Department of Economic and Social Affairs, Population Division, www.unpopulation.org, World Abortion Policies 2013, https://www.un.org/en/development/desa/population/publications/pdf/policy/WorldAbortionPolicies2013/WorldAbortionPolicies2013_WallChart.pdf (Accessed May 2019)
- U.S. Department of State, Bureau of Democracy, Human Rights, and Labor. 2015 Country Reports on Human Rights Practices Report, April 13, 2016. https://2009-2017.state.gov/secretary/remarks/2016/04/255799.htm
- Centers for Disease Control and Prevention, Heart Disease Facts, https://www.cdc.gov/heartdisease/facts.htm (Accessed April 2019) Data set used is from CDC, NCHS. Underlying Cause of Death 1999-2013 on CDC WONDER Online Database, released 2015. Data are from the Multiple Cause of Death Files, 1999-2013, as compiled from data provided by the 57 vital statistics jurisdictions through the Vital Statistics Cooperative Program. (Accessed Feb. 3, 2015.)
- Centers for Disease Control and Prevention, National Center for Injury Prevention and Control. WISQARS™, Leading Causes of Death Reports, 1981 – 2017. https://webappa.cdc.gov/sasweb/ncipc/leadcause.html (Accessed April 2019)
- U.S. Cancer Statistics Working Group. U.S. Cancer Statistics Data Visualizations Tool, based on November 2018 submission data (1999-2016): U.S. Department of Health and Human Services, Centers for Disease Control and Prevention and National Cancer Institute; www.cdc.gov/cancer/dataviz, June 2019. https://gis.cdc.gov/Cancer/USCS/DataViz.html
- American Cancer Society, https://www.cancer.org/cancer/cancer-basics/lifetime-probability-of-developing-or-dying-from-cancer.html (Accessed April 2019)
- Siegel, R. L., Miller, K. D. and Jemal, A. (2019), Cancer statistics, 2019. CA A Cancer J Clin, 69: 7-34. doi:10.3322/caac.21551 https://onlinelibrary.wiley.com/doi/epdf/10.3322/caac.21551
- Medical News Today, https://www.medicalnewstoday.com/articles/282929.php (Accessed April 2019)
- National Cancer Institute, https://www.cancer.gov/about-cancer/understanding/statistics (Accessed April 2019)
- Canadian Cancer Society, https://www.cancer.ca/en/cancer-information/cancer-101/cancer-statistics-at-a-glance/?region=on (Accessed June 2019)
- Cancer Research UK, https://www.cancerresearchuk.org/health-professional/cancer-statistics/risk#heading-Zero (Accessed April 2019)
- Cancer Research UK, https://www.cancerresearchuk.org/health-professional/cancer-statistics/mortality#heading-Zero (Accessed April 2019)
- Cancer Medicine 2016; 5(9): 2649–2656, Projections of cancer incidence and cancer‐related deaths in Germany by 2020 and 2030. By Quante et al. https://onlinelibrary.wiley.com/doi/full/10.1002/cam4.767
- Australian Government, Australian Institute of Health and Welfare, Cancer, overview https://www.aihw.gov.au/reports-data/health-conditions-disability-deaths/cancer/overview (Accessed April 2019)
- New Zealand Herald, https://healthcentral.nz/global-cancer-rates-how-does-nz-compare/ (Accessed April 2019)
- Dr. Martin Makary, M.D., M.P.H., Professor of Surgery at Johns Hopkins University School of Medicine, https://www.bmj.com/content/353/bmj.i2139.full (Accessed April 2019)
- https://www.bmj.com/content/353/bmj.i2139/rapid-responses (Accessed April 2019)
- The Commonwealth Fund: https://www.commonwealthfund.org/press-release/2005/international-survey-us-leads-medical-errors (Accessed April 2019)
- Centers for Disease Control and Prevention, National Center for Health Statistics. National Vital Statistics Reports, Volume 67, Number 5 July 26, 2018. Deaths: Final Data for 2016, https://www.cdc.gov/nchs/data/nvsr/nvsr67/nvsr67_05.pdf (Accessed April 2019)
- Centers for Disease Control and Prevention/National Center for Health Statistics, Table 19. Leading causes of death and numbers of deaths, by sex, race, and Hispanic origin: United States, 1980 and 2016. https://www.cdc.gov/nchs/data/hus/2017/019.pdf (Accessed April 2019)
- National Institutes of Health, https://ods.od.nih.gov/factsheets/list-VitaminsMinerals/ (Accessed April 2019)
- Centers for Disease Control and Prevention, Stroke. https://www.cdc.gov/stroke/ (Accessed April 2019)
- Mozzafarian D, Benjamin EJ, Go AS, Arnett DK, Blaha MJ, Cushman M, et al., on behalf of the American Heart Association Statistics Committee and Stroke Statistics Subcommittee. Heart disease and stroke statistics—2016 update: a report from the American Heart Association. Circulation 2016;133(4):e38–360. https://www.ahajournals.org/doi/10.1161/CIR.0000000000000350
- Centers For Disease Control and Prevention, Stroke Facts. https://www.cdc.gov/stroke/facts.htm (Accessed April 2019)
- Lazarou J., Pomeranz B.H.,Corey P.N. Incidence of adverse drug reactions in hospitalized patients: A meta-analysis of prospective studies. Journal of the American Medical Association. 1998;279(15):1200-1205 https://pdfs.semanticscholar.org/d87c/8a387d36b8236a3daed82221617e500e9655.pdf (Accessed April 2019)
- Dormann H., Criegee-Rieck M., Neubert A., et al. Lack of awareness of community-acquired adverse drug reactions upon hospital admission : Dimensions and consequences of a dilemma. Drug Safety. 2003;26(5):353-362. https://www.researchgate.net/publication/10843421_Lack_of_Awareness_of_Community-Acquired_Adverse_Drug_Reactions_Upon_Hospital_Admission
- Zed, Peter. (2005). Drug-Related Visits to the Emergency Department. Journal of Pharmacy Practice. 18. 329-335. https://www.researchgate.net/publication/247780647_Drug-Related_Visits_to_the_Emergency_Department
- Classen D.C., Pestotnik S.L., Evans R.S., Lloyd J.F., Burke J.P. Adverse drug events in hospitalized patients: Excess length of stay, extra costs, and attributable mortality. Journal of the American Medical Association. 1997;277(4):301-306. https://jeffreydachmd.com/wp-content/uploads/2013/07/Adverse-drug-events-hospitalized-patients-excess-length-of-stay-extra-costs-mortality-Classen-Jama-1997.pdf
- Klevens, R. Monina; Edwards, Jonathan R.; Richards, Chesley L.; Horan, Teresa C.; Gaynes, Robert P; Pollock, Daniel A.; Cardo, Denise M. (2007). “Estimating Healthcare-associated Infections and Deaths in U.S. Hospitals, 2002”. Public Health Reports. 122 (2): 160–166. https://www.ncbi.nlm.nih.gov/pmc/articles/PMC1820440/
- Patient Care Link, Healthcare-Acquired Infections (HAIs), https://patientcarelink.org/improving-patient-care/healthcare-acquired-infections-hais/
- Centers for Disease Control and Prevention, National Center for Health Statistics. Underlying Cause of Death 1999-2017 on CDC WONDER Online Database, released December, 2018. Data are from the Multiple Cause of Death Files, 1999-2017, as compiled from data provided by the 57 vital statistics jurisdictions through the Vital Statistics Cooperative Program. Accessed at http://wonder.cdc.gov/ucd-icd10.html on Apr 15, 2019 5:08:00 PM
- National Institute on Drug Abuse, https://www.drugabuse.gov/drugs-abuse/opioids/opioid-overdose-crisis#one (Accessed April 2019)
- American Foundation for Suicide Prevention, https://afsp.org/suicide-statistics/ (Accessed April 2019)
- Centers for Disease Control and Prevention, National Center for Health Statistics. Chronic Liver Disease and Cirrhosis. https://www.cdc.gov/nchs/fastats/liver-disease.htm (Accessed April 2019)
- National Transportation Safety Board, https://www.ntsb.gov/news/press-releases/PublishingImages/US-TransportationFatalities2017.jpg (Accessed April 2019)
- National Transportation Safety Board, https://www.ntsb.gov/news/press-releases/Pages/mr20181101.aspx (Accessed April 2019)
- Centers for Disease Control and Prevention, National Center for Health Statistics. Underlying Cause of Death 1999-2017 on CDC WONDER Online Database, released December, 2018. Data are from the Multiple Cause of Death Files, 1999-2017, as compiled from data provided by the 57 vital statistics jurisdictions through the Vital Statistics Cooperative Program. Accessed at http://wonder.cdc.gov/ucd-icd10.html on Apr 15, 2019 5:08:00 PM
- Centers for Disease Control and Prevention, Antibiotic / Antimicrobial Resistance (AR / AMR). https://www.cdc.gov/drugresistance/biggest_threats.html (Accessed April 2019)
- HIV.Gov, https://www.hiv.gov/hiv-basics/overview/data-and-trends/statistics (Accessed April 2019)
- United States Department of Labor, Bureau of Labor Statistics. Static charts, Census of Fatal Occupational Injuries, 2017. https://www.bls.gov/iif/oshwc/cfoi/cfch0016.pdf (Accessed April 2019)
- United States Department of Labor, Bureau of Labor Statistics. Labor Force Statistics from the Current Population Survey. https://data.bls.gov/timeseries/LNS12000000 Data extracted on: April 15, 2019 (12:43:03 PM)
- Governors Highway Safety Association, Pedestrian Traffic Fatalities by State: 2018 Preliminary Data, https://www.ghsa.org/resources/Pedestrians19 (Accessed April 2019)
- Centers for Disease Control and Prevention, National Center for Health Statistics. Underlying Cause of Death 1999-2017 on CDC WONDER Online Database, released December, 2018. Data are from the Multiple Cause of Death Files, 1999-2017, as compiled from data provided by the 57 vital statistics jurisdictions through the Vital Statistics Cooperative Program. Accessed at http://wonder.cdc.gov/ucd-icd10.html on Apr 22, 2019 9:33:48 PM
- Centers for Disease Control and Prevention, National Center for Health Statistics. Underlying Cause of Death 1999-2017 on CDC WONDER Online Database, released December, 2018. Data are from the Multiple Cause of Death Files, 1999-2017, as compiled from data provided by the 57 vital statistics jurisdictions through the Vital Statistics Cooperative Program. Accessed at http://wonder.cdc.gov/ucd-icd10.html on Apr 15, 2019 5:08:00 PM
- Centers for Disease Control and Prevention, National Center for Health Statistics. Underlying Cause of Death 1999-2017 on CDC WONDER Online Database, released December, 2018. Data are from the Multiple Cause of Death Files, 1999-2017, as compiled from data provided by the 57 vital statistics jurisdictions through the Vital Statistics Cooperative Program. Accessed at http://wonder.cdc.gov/ucd-icd10.html on Apr 15, 2019 6:25:43 PM
- Centers for Disease Control and Prevention https://www.cdc.gov/vitalsigns/alcohol-poisoning-deaths/index.html (Accessed May 2019)
- Mapping Police Violence, https://mappingpoliceviolence.org/ (Accessed May 2019)
- Centers for Disease Control and Prevention, National Center for Health Statistics. Underlying Cause of Death 1999-2017 on CDC WONDER Online Database, released December, 2018. Data are from the Multiple Cause of Death Files, 1999-2017, as compiled from data provided by the 57 vital statistics jurisdictions through the Vital Statistics Cooperative Program. Accessed at http://wonder.cdc.gov/ucd-icd10.html on Apr 15, 2019 5:08:00 PM
- Centers for Disease Control and Prevention, National Center for Health Statistics. Underlying Cause of Death 1999-2017 on CDC WONDER Online Database, released December, 2018. Data are from the Multiple Cause of Death Files, 1999-2017, as compiled from data provided by the 57 vital statistics jurisdictions through the Vital Statistics Cooperative Program. Accessed at http://wonder.cdc.gov/ucd-icd10.html on Apr 15, 2019 6:16:44 PM
- Insurance Information Institute, https://www.iii.org/fact-statistic/facts-statistics-sports-injuries (Accessed April 2019)
- Insurance Information Institute, https://www.iii.org/table-archive/20657 (Accessed April 2019)
- Centers for Disease Control and Prevention, National Center for Health Statistics. Underlying Cause of Death 1999-2017 on CDC WONDER Online Database, released December, 2018. Data are from the Multiple Cause of Death Files, 1999-2017, as compiled from data provided by the 57 vital statistics jurisdictions through the Vital Statistics Cooperative Program. Accessed at http://wonder.cdc.gov/ucd-icd10.html on Apr 15, 2019 5:59:35 PM
- U.S. News and World Report, Hot Tap Water May Pose Scalding Hazard, https://health.usnews.com/health-news/news/articles/2013/03/31/hot-tap-water-may-pose-scalding-hazard
- Centers for Disease Control and Prevention, National Center for Health Statistics. Underlying Cause of Death 1999-2017 on CDC WONDER Online Database, released December, 2018. Data are from the Multiple Cause of Death Files, 1999-2017, as compiled from data provided by the 57 vital statistics jurisdictions through the Vital Statistics Cooperative Program. Accessed at http://wonder.cdc.gov/ucd-icd10.html on Apr 15, 2019 5:39:09 PM
- The Weather Channel, https://weather.com/storms/tornado/news/2018-01-16-no-tornado-deaths-record-streak (Accessed April 2019)
- Centers for Disease Control and Prevention, National Center for Health Statistics. Underlying Cause of Death 1999-2017 on CDC WONDER Online Database, released December, 2018. Data are from the Multiple Cause of Death Files, 1999-2017, as compiled from data provided by the 57 vital statistics jurisdictions through the Vital Statistics Cooperative Program. Accessed at http://wonder.cdc.gov/ucd-icd10.html on Apr 15, 2019 5:24:20 PM
- Langley RL. Animal-related fatalities in the United States-an update. Wilderness Environ Med 2005;16:67–74.doi:10.1580/1080-6032(2005)16[67:AFITUS]2.0.CO;2. https://pdfs.semanticscholar.org/6690/bb763558cc312525434ff40e2545c2f069c3.pdf
- Centers for Disease Control and Prevention, National Center for Health Statistics. Underlying Cause of Death 1999-2017 on CDC WONDER Online Database, released December, 2018. Data are from the Multiple Cause of Death Files, 1999-2017, as compiled from data provided by the 57 vital statistics jurisdictions through the Vital Statistics Cooperative Program. Accessed at http://wonder.cdc.gov/ucd-icd10.html on Apr 15, 2019 7:18:04 PM
- National Oceanic and Atmospheric Administration, National Weather Service, https://www.weather.gov/safety/lightning-fatalities (Accessed April 2019)
- Centers for Disease Control and Prevention, National Center for Health Statistics. Underlying Cause of Death 1999-2017 on CDC WONDER Online Database, released December, 2018. Data are from the Multiple Cause of Death Files, 1999-2017, as compiled from data provided by the 57 vital statistics jurisdictions through the Vital Statistics Cooperative Program. Accessed at http://wonder.cdc.gov/ucd-icd10.html on Apr 15, 2019 5:32:47 PM
- Centers for Disease Control and Prevention, https://www.cdc.gov/mmWR/preview/mmwrhtml/mm5829a2.htm (Accessed April 2019)
- Centers for Disease Control and Prevention, Dog-Bite-Related Fatalities — United States, 1995-1996, May 30, 1997 / 46(21);463-466, Morbidity and Mortality Weekly Report. https://www.cdc.gov/Mmwr/preview/mmwrhtml/00047723.htm (Accessed April 2019)
- U.S. Department of Transportation, National Highway Traffic Safety Administration, https://crashstats.nhtsa.dot.gov/Api/Public/ViewPublication/812476.pdf (Accessed April 2019)
- Centers for Disease Control and Prevention, National Center for Health Statistics. Underlying Cause of Death 1999-2017 on CDC WONDER Online Database, released December, 2018. Data are from the Multiple Cause of Death Files, 1999-2017, as compiled from data provided by the 57 vital statistics jurisdictions through the Vital Statistics Cooperative Program. Accessed at http://wonder.cdc.gov/ucd-icd10.html on Apr 15, 2019 5:44:22 PM
- University of Florida, Department of Wildlife Ecology & Conservation. http://ufwildlife.ifas.ufl.edu/venomous_snake_faqs.shtml (Accessed April 2019)
- Pelletier AR, Gilchrist J. Roller coaster related fatalities, United States, 1994–2004. Inj Prev. 2005;11(5):309–312. https://www.ncbi.nlm.nih.gov/pmc/articles/PMC1730261/ (Accessed April 2019)
- The U.S. Consumer Product Safety Commission https://www.cpsc.gov/newsroom/news-releases/1996/cpsc-soda-vending-machine-industry-labeling-campaign-warns-of-deaths-and-injuries/ (Accessed April 2019)
- KTUU-TV, Anchorage, Alaska, https://www.ktuu.com/content/news/MAP-Fatal-Bear-Attacks-in-North-America-432734333.html (Accessed April 2019)
- Florida Shark Museum https://www.floridamuseum.ufl.edu/shark-attacks/yearly-worldwide-summary/ (Accessed April 2019)
The watching, interacting and participation of any kind and in any way with anything on this video, multimedia, article or page does not constitute or initiate a doctor patient relationship with Dr. Farrah®. None of the statements here have been evaluated by the Food and Drug Administration (FDA). The products of Dr. Farrah® are not intended to diagnose, treat, cure, or prevent any disease. The information being provided should only be considered for education and entertainment purposes only. If you feel that anything you see or hear may be of value to you on this video or on any video or other medium of any kind associated with, showing or quoting anything relating to Dr. Farrah® in any way at any time, you are encouraged to and agree to consult with a licensed healthcare professional in your area to discuss it. If you feel that you’re having a healthcare emergency, seek medical attention immediately. The views expressed here are not medical advice, they are simply the viewpoints and opinions of Dr. Farrah® or others appearing and are protected under the first amendment.
Dr. Farrah® is a highly experienced Licensed Medical Doctor, not some enthusiast, formulator or medium promoting the wild and unrestrained use of herbs and nutrition products for health issues without clinical experience and scientific evidence of therapeutic benefit. Dr. Farrah® promotes evidence-based natural approaches to health, which means integrating her individual scientific and clinical expertise with the best available external clinical evidence from systematic research as well as from the recommendations and experiences of respected experts. By individual clinical expertise, I refer to the proficiency and judgment that individual clinicians acquire through clinical experience and clinical practice.
Dr. Farrah® does not make any representation or warranties with respect to the accuracy, applicability, fitness, or completeness of any video or multimedia content provided anywhere at any time. Dr. Farrah® does not warrant the performance, effectiveness or applicability of any sites listed, linked or referenced to, in, or by any video content related to her, showing her or referencing her at any time.
To be clear, the video or multimedia content provided is not intended to be a substitute for professional medical advice, diagnosis, or treatment. Always seek the advice of your physician or other qualified health provider with any questions you may have regarding a medical condition. Never disregard professional medical advice or delay in seeking it because of something you have read or seen in any website, video, article or multimedia of any kind.
Dr. Farrah® hereby disclaims any and all liability to any party for any direct, indirect, implied, punitive, special, incidental or other consequential damages arising directly or indirectly from any use of this or any other video or multimedia content, which is provided as is, and without warranties.


